Final Project Post

PROJECT POST #8

Project Title: Vis Hat  

Project Team: Lydia, Fu, Jay

Sentence Description:

Exploring the ways in which we can see our mind respond to our environment by gathering brain data in a more user-integrated technological experience.

Video:

Description: All IR emitter and photodiode detector hardware is built into the front 3D-printed plastic compartment. The compartment is attached to a static strap which leads all wires from the front component to the back of the strap near the back of the head. Wires are attached to this strap via zig-zag stitching. The hardware in the back includes a protoboard with all wire connections to the emitter/detector setup and the Arduino Due which is used to transfer data via a USB cable to a computer. These components are housed in a neoprene pocket with drawstrings to close off visible wires. The other strap is neoprene and flexible to allow for different adjustments for various head shapes/sizes and is attached to the end of the static strap with velcro.

Video: 

Link

Poster Image:

Project Description and Function:

The prefrontal cortex is located in the front/forehead area of the head. This area of the brain is known to play a critical role in human-emotion response and is also one of the most successful areas for NIRS data gathering.

IR emitters send infrared waves about 2 cm deep into the skull and detectors observe the refracted IR waves that bounce back out of the skull. These channels of detectors and emitters measure changes in oxy-hemoglobin levels in the brain, similar fMRI scans, but using more localized technology for a more personal experience.

Data is visualized in live time using Unity 3D/VR software, corresponding to an increase in activity related to heat/light. These heat and light changes relate to activity changes detected from the forehead/skull/brain within 2 cm deep from the surface mount.

Future applications for cognitive research, memory analysis, and visualization communication.

Project Feelings/Evaluation:

Considering our prior knowledge in all related subjects, we feel accomplished with our final product. We each, in our own ways, dove deeply into academic research outside our own fields, and brought those conclusions together to create something that accomplished our goal: to manipulate a virtual environment using data from the head. We’re each proud of our own work put towards the project, and each others.

Goal Meeting Description:

Our initial goal of coming up with a more wearable device that could monitor activity level changes near/around certain parts of the head for the purposes of visualization was definitely met. Because of the level of complexity associated with high-quality material sourcing and the accuracy expectations that come with building a similar device within a medical environment, we were unable to use the device with that same level of sensitivity. Overall this was a great learning process for us all and given all we discovered during the process, our final result definitely exceeded our expectations of our capabilities given our experience and time-frame.

Hurdles Encountered and Overcoming Challenges:

  • Lack of knowledge designing hardware
  • Lack of knowledge regarding brain physiology

    The ways that we overcame the hardware challenges are through steps by steps, we first tested all the components we need and make sure our proof of concept does work. Then we tried to create the first version of the circuit and discussed about the VIS HAT design. After all that testing process, we felt more confident about integrating all components together. Eventually, we think our project hardware design turns out to be pretty nice and satisfying.

    As to the brain physiology part, we spent a lot of time doing research and reading through a bunch of relative papers in order to know from basic brain knowledge and gradually know how we are going to build our VIS HAT, which also sort of relates to designing hardware.

Approach if we were to do it again/With more time:

With more time, we believe that we all want to spend more time on testing our VIS HAT and get a great amount of data from it. By doing so, we think we can definitely play with the data and analysis the data. With the data we get, we can surely define human brain activities and do some classification about it, which would be great that we show our VIS HAT functionality demo with the brain activities.

Final Materials:

title/link # needed price/unit notes shipping and tax TOTAL PRICE:
arduino due 1 34.43 34.43
NPN transistor 1 5.99 this one unit contains ~200 resistors 5.99
730nm emitter 2 8.61 9.54 26.76
850nm emitter 2 1.46 2.92
850 max nir detector/sensor 2 5.37 9.02 19.76
bluetooth 1 28.95 RN41XVC (with chip antenna) 8.81 37.76
850nm emitter 2 1.46 To account for trial and error hardware testing 7.99 9.45
9 volt battery power supply adapter 1 5.99 5.99
3d print in elastic material 1 0 0


Project Post #7

PROJECT POST #7

Project Title: Vis Hat  

Project Team: Lydia, Fu, Jay


Weekly Accomplishments:

Lydia:

  • Found example/reference code for data visualization
  • Researched and learned more programming language syntax for d3.js visualization software (Javascript, HTML, CSS)
  • Researched setting up live data visualization
  • Planned and designed wiring setup for final prototype
  • 3d modeled final prototype for headset with integrated wiring setup
  • Attempted 3d printed final prototype in elastic material (design construction not compatible with elastic or flexible material)
  • 3d printed backup model in PLA hard plastic (will still work better than first prototype because of more specific measurements and wire structuring)

Fu:

  • Design and finalize circuit setup.
  • Soldering circuit on proto board and check its functionality.
  • Setting prototype and test it.

Jay:

  • Wrote code for emitter cycles
  • Looking into D3 data visualization
  • Poster design and some of the text

Images:

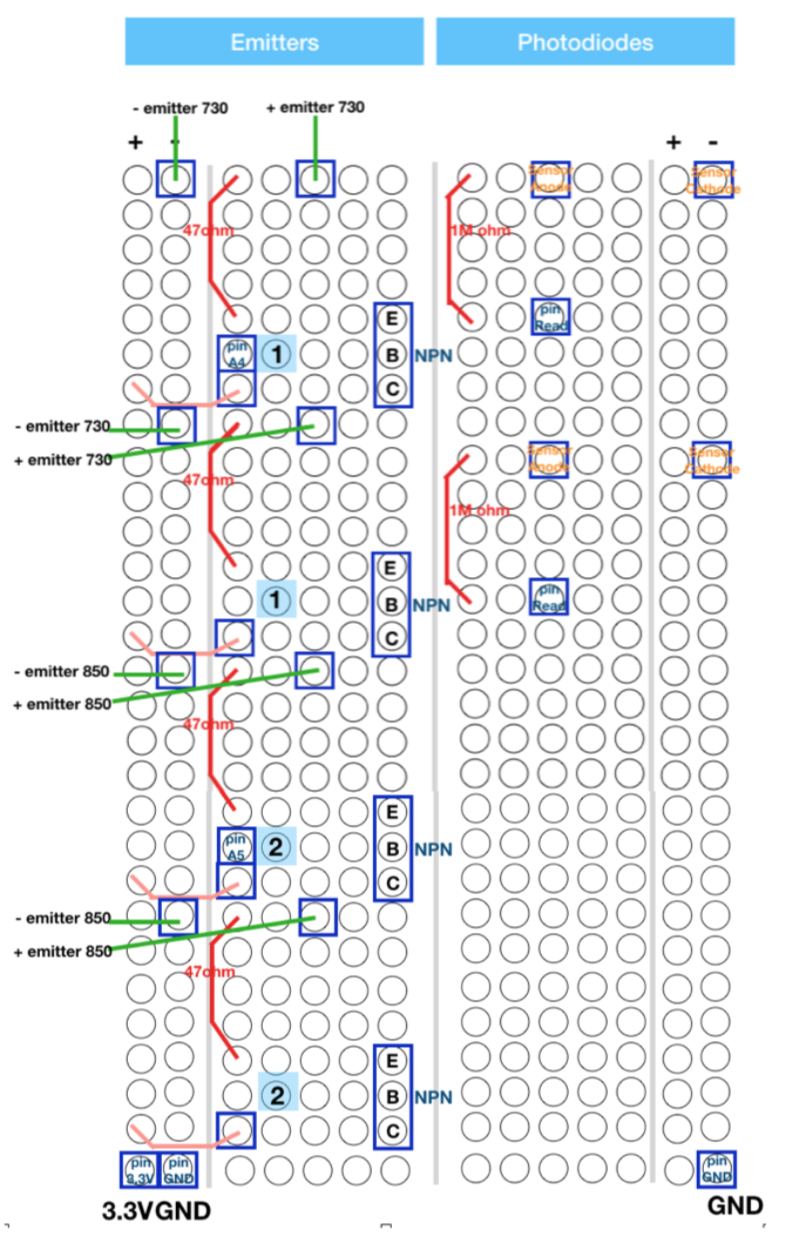
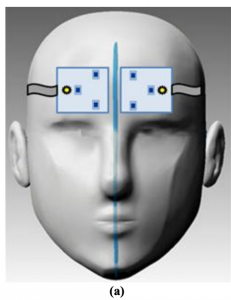
  • (Image 1) The following image shows the design and position on how emitters, resistors, transistors, and photodiodes are positioned.
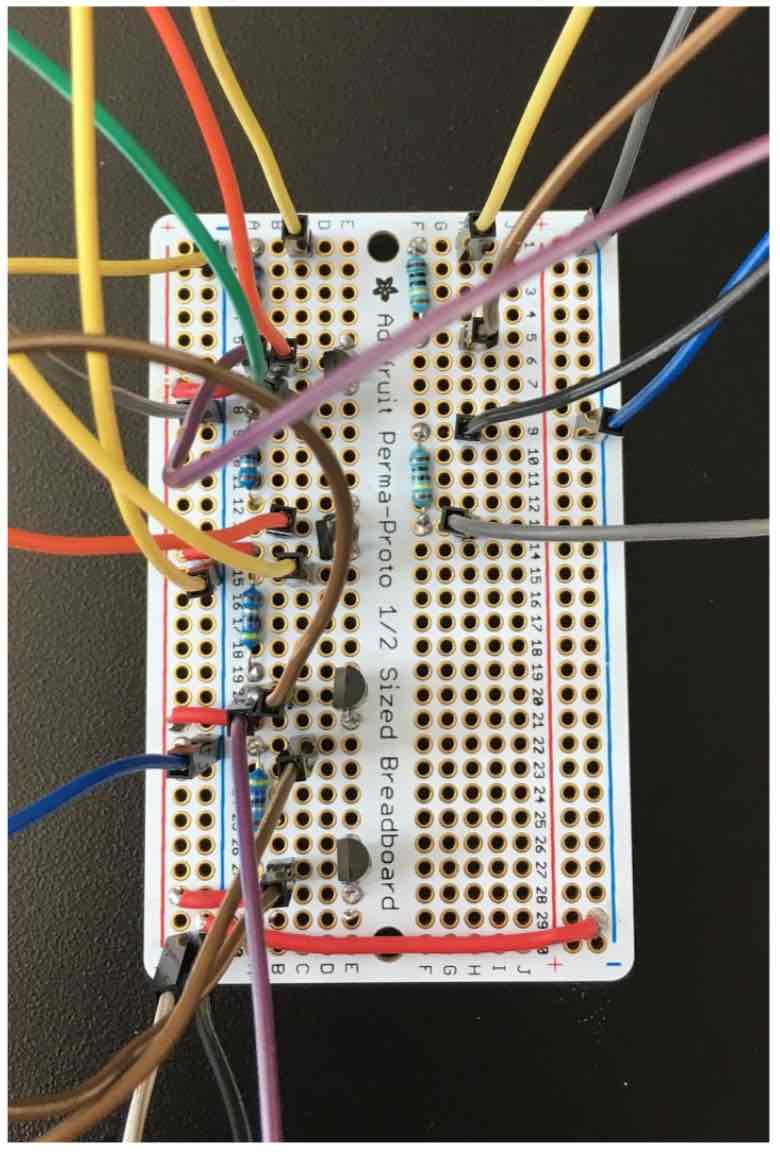
  • (Image 2) The image below shows the actual circuit built on proto board, which looks less bulky than using breadboard. Also, we reduced some redundant pins and integrated them together. This circuit is our final version.  
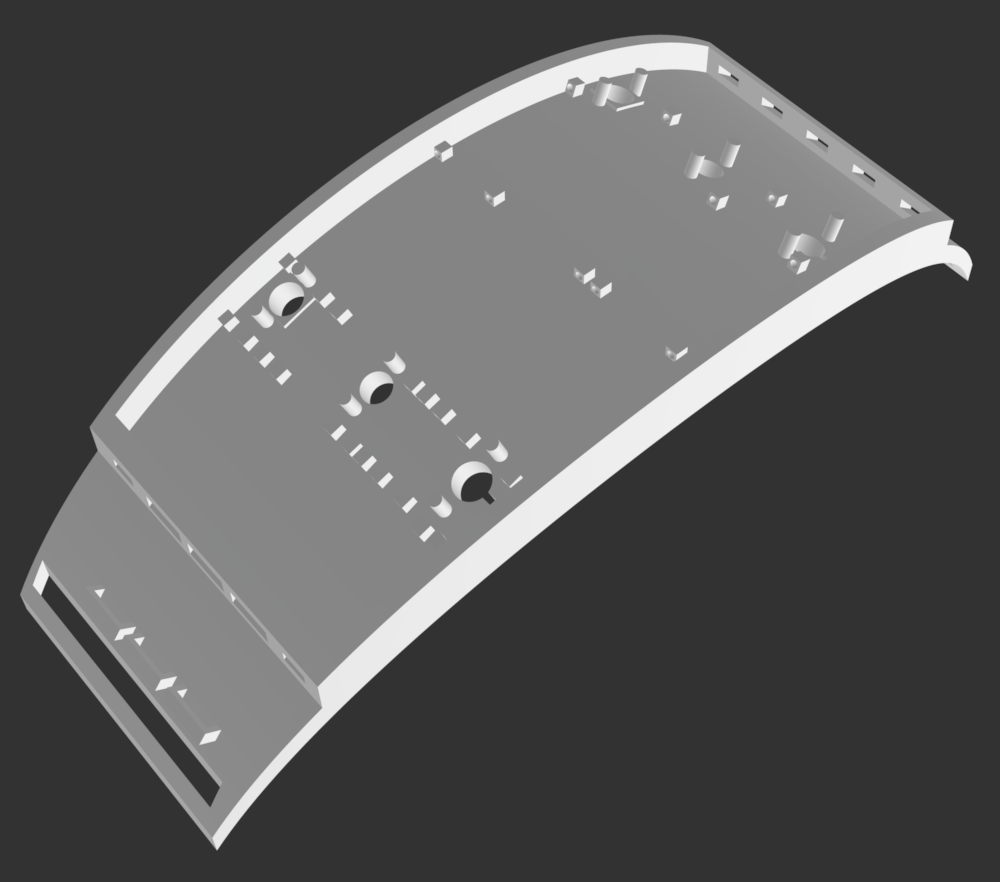
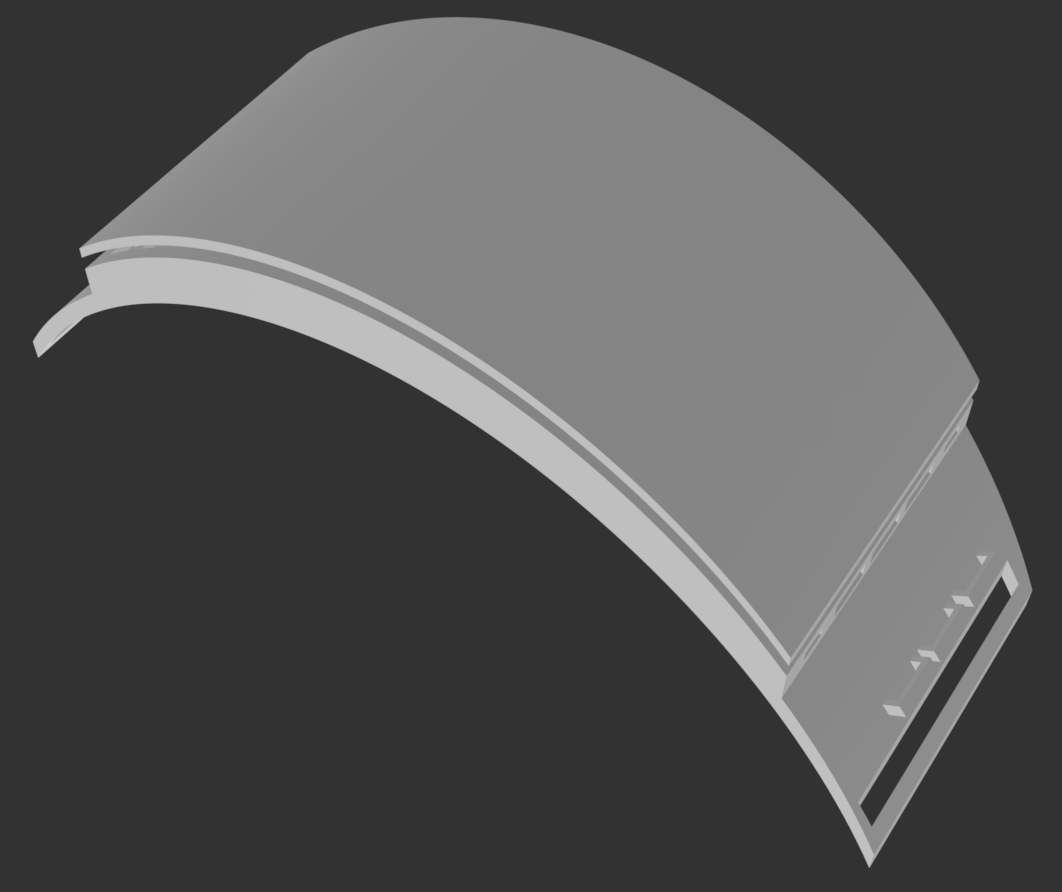
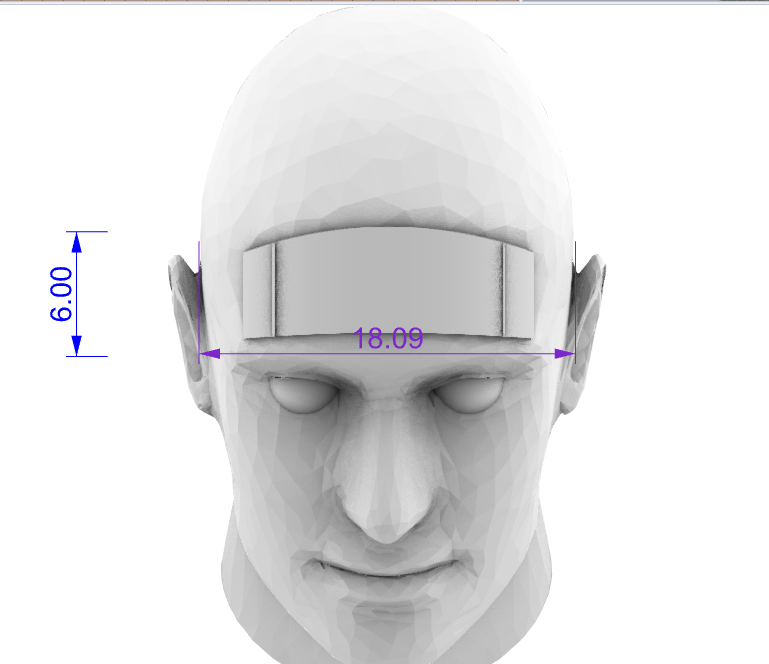
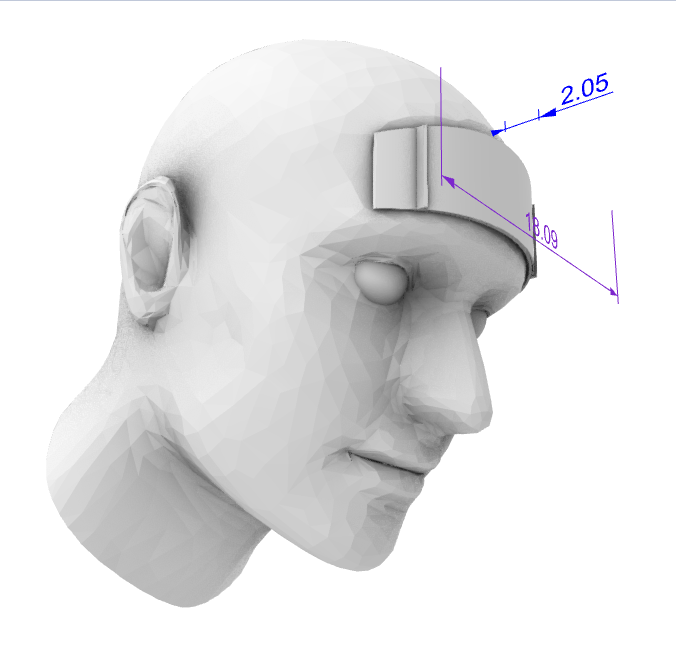
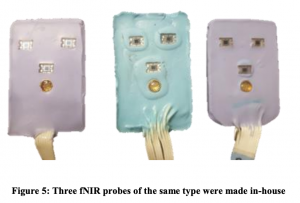
  • (Image 3 & 4) These images are of the updated prototype model with added specified dimensions, wire structuring, and cover.


Material List:

title/link # needed price/unit notes shipping and tax TOTAL PRICE:
arduino due 1 34.43 34.43
NPN transistor 1 5.99 this one unit contains ~200 resistors 5.99
730nm emitter 2 8.61 9.54 26.76
850nm emitter 2 1.46 2.92
850 max nir detector/sensor 2 5.37 9.02 19.76
bluetooth 1 28.95 RN41XVC (with chip antenna) 8.81 37.76
850nm emitter 2 1.46 To account for trial and error hardware testing 7.99 9.45
9 volt battery power supply adapter 1 5.99 5.99
3d print in elastic material 1 0 0

Project Concerns:

This week with the new prototype printed and all the hardware reconfigured in smaller more condensed setup, we are ready to construct the final complete Viz Hat. Here are some concerns for the week:

  • Obtaining data that’ll work. We need to do several tests this week to make sure the data we’re gathering can be used consistently for the visualization.
  • Getting the visualization ready. We’ve found some already existing code we’d like to implement with the parameters of our data, but we need to work on initializing it in live time and getting the data to transfer from the Arduino serial port to D3.js’s software.

Other than these two concerns, the remaining steps we need to take should be pretty straightforward. These include finishing the headset assembly, which is all planned out and configuring the demo. Our plan for the demo is to (1) have the Viz Hat set up on the head manakin, (2) display and explain the concept and process with our poster, (3) have a laptop/screen with a looping video of the Viz Hat working (gathering data and producing a visualization in the background). This 3rd component alleviates the potential for any technological difficulties that could arise with a live demo.

Project Post #6

PROJECT POST #6

Project Title: Vis Hat  

Project Team: Lydia, Fu, Jay

1 Sentence: This Vis Hat collects and visualizes your brain data as you respond to your environment using Near Infrared Spectroscopy technology.

Weekly Accomplishments:

Lydia:

  • 3D modeled and printed the first prototype for housing photodiode emitter and detectors
  • Planned out remaining prototype design construction
  • Built first rendition of prototype for Vis Hat
  • Looking into current visualization code

Fu:

  • Circuit assembly on breadboard, optimize and design final circuit on protoboard..
  • NPN transistor build in circuit.
  • Tuning the resistor for higher sensitivity.
  • Looking code for duty cycles.

Jay:

  • Proof of concept testing, breath test using diodes on head
  • Circuit assembly
  • Resistor adjustments for sensitivity of photodiode
  • NPN transistor added for control of emitters
  • Code to address NPN Transistors
  • Started code for duty cycles of scanner

Images:

Image 1 is of the 3d model in rendered form

Image 2 is a photo of updated prototype model notes

Image 3 is of the completed circuit on breadboard


Material List:

title/link # needed price/unit notes shipping and tax TOTAL PRICE:
arduino due 1 34.43 34.43
NPN transistor 1 5.99 this one unit contains ~200 resistors 5.99
730nm emitter 2 8.61 9.54 26.76
850nm emitter 2 1.46 2.92
850 max nir detector/sensor 2 5.37 9.02 19.76
bluetooth 1 28.95 RN41XVC (with chip antenna) 8.81 37.76
850nm emitter 2 1.46 To account for trial and error hardware testing 7.99 9.45
9 volt batter power supply adapter 1 5.99 5.99

Project Concerns:

At this point we are in the home stretch of the course with a good amount to do. We have it all planned out, which works with the schedule but at this point have two potential concerns. One is that things take longer than planned. We hope to finish the build and testing this coming week, which could mean we find out our data gathering isn’t where it needs to be. The following week we’ve left for data visualization, which encompasses the data analysis and cleanup portion of the project, the demo setup (figuring out a good way of displaying everything for the demo and presentation) and coding the actual visuals. This shouldn’t be too big of a task, we just need to make sure we’re on top of it and thinking ahead. We’re planning to meet more outside of class time and planning for things in the meantime beforehand.


Project Post #5

PROJECT POST #4

Project Title: Vis Hat  

Project Team: Lydia, Fu, Jay

Weekly Accomplishments:

Lydia:

  • Researched: visualization software and data transferring methods; existing data visualization; 3D printing materials
  • Visited maker-space and discussed 3D printing material specifications and properties to find best suited material for our project (we will be using elastic resin 3D printing material for the base and hard pva for the cover
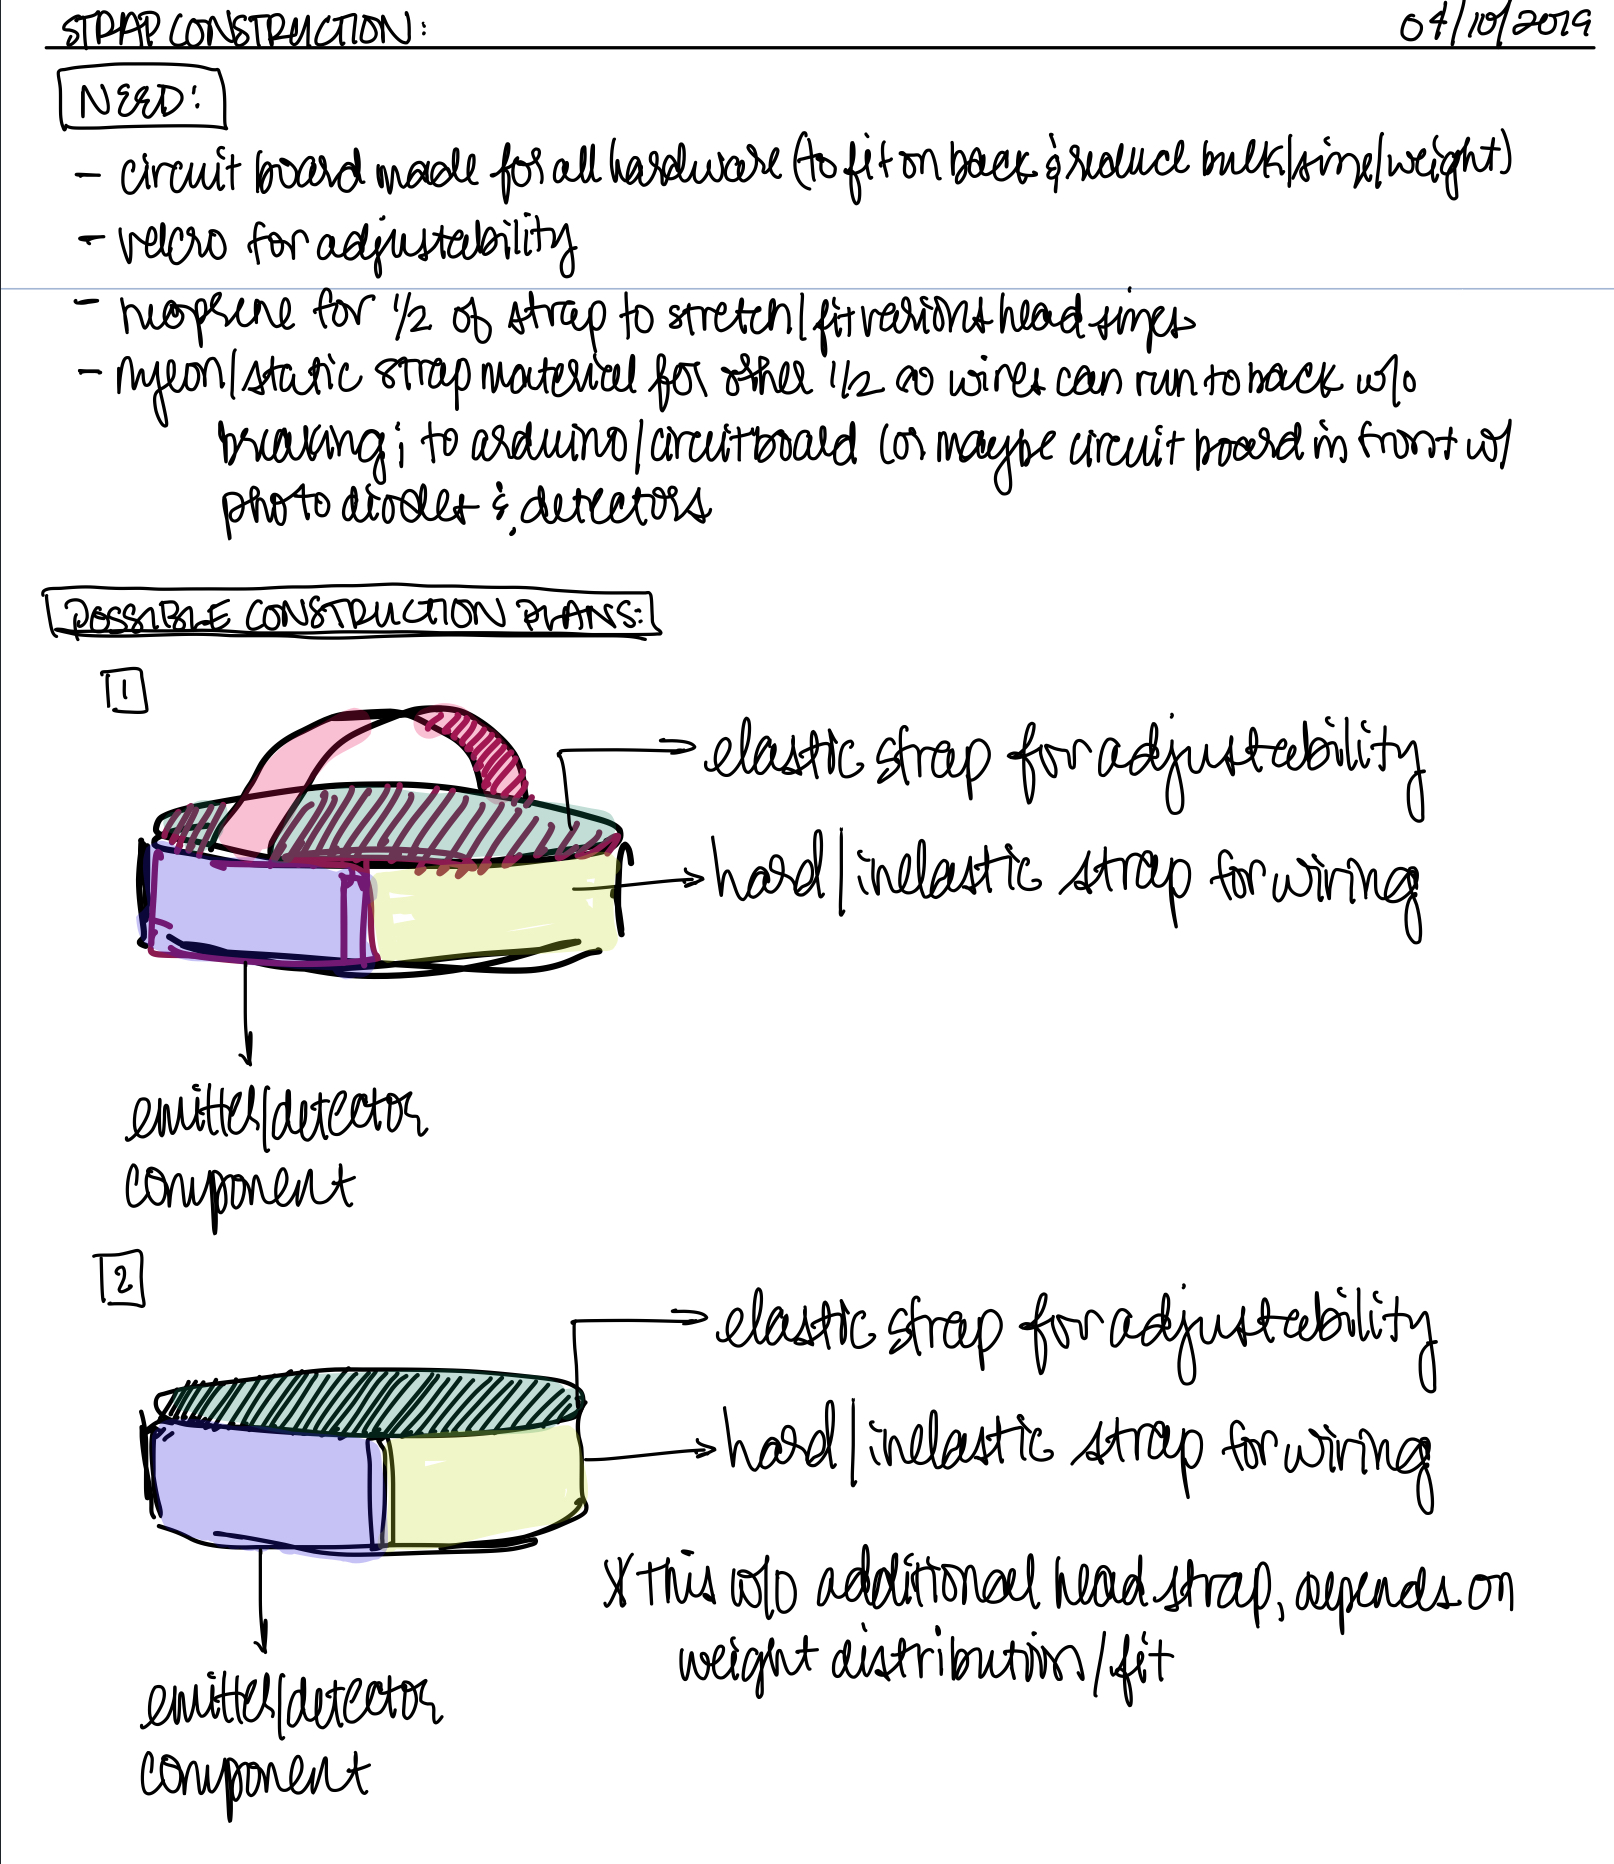
  • Further drafted construction of 3D printed components and design of VisHat overall
  • Continued compiling experiment/testing procedures for data collection in response to different stimulus

Fu:

  • Finishing emitter and photodiode circuit connected to Arduino Due.
  • Test and complete Arduino Due analog read and pin out control.

Jay:

  • Completed emitter detector circuit and tested on head
  • Diagramed finished circuit
  • Fine tuning relating to current going to emitters, and sensitivity of the photodiode

Images:

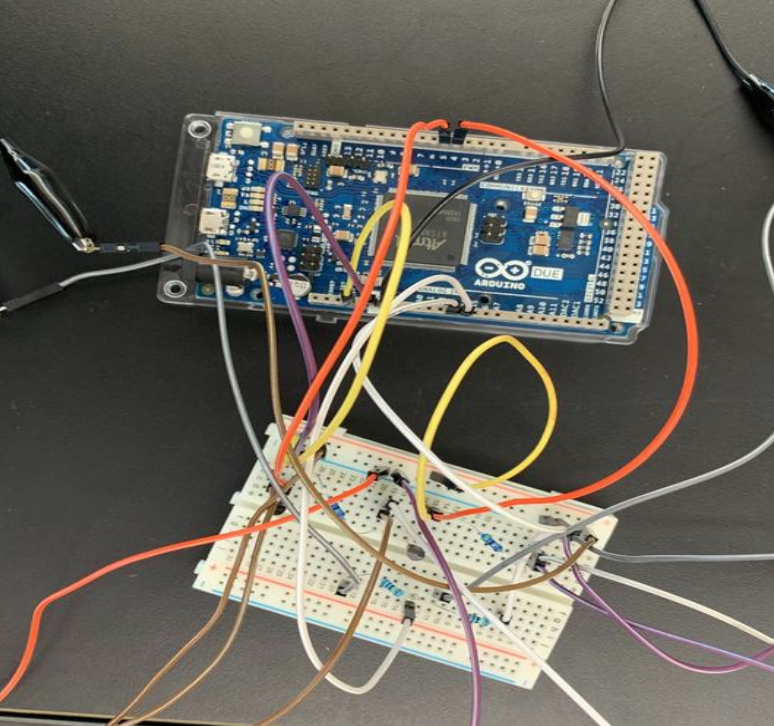
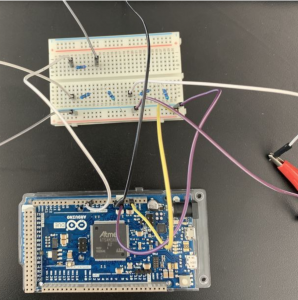
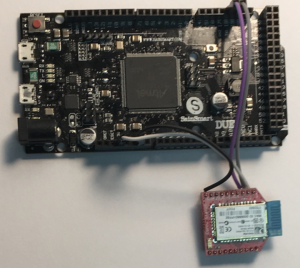
Image 1 is a photo of the circuit setup connected to the Arduino Due

Image 2 is a diagram of the VisHat headpiece construction

Material List:

title/link # needed price/unit notes shipping and tax TOTAL PRICE:
arduino due 1 34.43 34.43
NPN transistor 1 5.99 this one unit contains ~200 resistors 5.99
730nm emitter 2 8.61 9.54 26.76
850nm emitter 2 1.46 2.92
850 max nir detector/sensor 2 5.37 9.02 19.76
bluetooth 1 28.95 RN41XVC (with chip antenna) 8.81 37.76
850nm emitter 2 1.46 To account for trial and error hardware testing 7.99 9.45

Project Concerns:

Now that we’re getting to the point of proof of concept a concern we may face might be noise within the data. We’ve been able to get response from the detectors that seems consistent with actions but whether or not the data collected when the emitters and detectors are placed on the head is from actual refraction or just from external stimulus may be hard to detect. Hopefully when we get to the testing stage we’ll know more about the state of the data.

Additionally, the 3D printing material we’ll be using is clear/transparent and that, too, may affect the kind of data gathered. The material can be painted so this could be a good plan to reduce additional noise.

Finally, we’re coming up on the mounting stage where the soon-to-be 3D components are attached/positioned on a user’s head. Everyone’s head shape is slightly different, so finding a way to make these as universally-fitting as possible while still maintaining structural integrity to the degree we need for the channels to remain stable enough may be difficult. The plan for now is to print a version 1 of the model, test it and its fit, and see if additional material integration like firm foam or memory foam to fit the hardware more securely to someone’s head might be needed for this to work best.


Project Post #4

PROJECT POST #4

Project Title: Vis Hat  

Project Team: Lydia, Fu, Jay, Sharon

Weekly Accomplishments:

Lydia:

  • Researched: data collection tests/experiments to detect data quality and collection; fNIRS data collection and analysis software; prefrontal cortex data and emotional correlation; applications for fNIRS testing to come up with other possible applications for the final project presentation
  • Started drafting a testing experiment procedure
  • Downloaded brain data analysis and gathering software, researching this and how to use it
  • Starting to draft prototype designs for 3D printed component

Fu:

  • Hardware testing, both emitters and photodiodes.
  • Wiring through breadboard, debugging and checking circuit design.
  • Checking the photodiode analog reading works.

Jay:

  • Power to both emitter and sensor
  • Started on code for analog reading from the sensor
  • Read signal through finger to complete proof of concept (detect signal passing through skin, blood and bone)

Sharon:

Images:

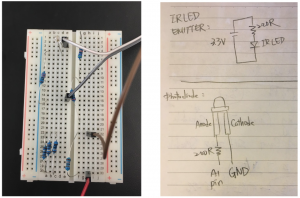
The following images show the actual testing circuit for the emitters and sensor, with a quick note about the diagram of the testing circuit.


Material List:

title/link # needed price/unit notes shipping and tax TOTAL PRICE:
arduino due 1 34.43 34.43
NPN transistor 1 5.99 this one unit contains ~200 resistors 5.99
730nm emitter 2 8.61 9.54 26.76
850nm emitter 2 1.46 2.92
850 max nir detector/sensor 2 5.37 9.02 19.76
bluetooth 1 28.95 RN41XVC (with chip antenna) 8.81 37.76
850nm emitter 2 1.46 To account for trial and error hardware testing 7.99 9.45

Project Concerns:

One potential concern might account for how much troubleshooting we will have to do with planning out and executing hardware and software. Considering we only have 5 weeks left, we might want to come up with additional plans for the application of the final project presentation. Below are a few initial ideas, but we may add to this list in the future. This concern isn’t too pressing now, as we have a few more initial technical aspects to develop, but initializing these ideas now could be a good idea and as our project continues to progress, the ideas could help how we navigate things in the future.

A folder in our group’s shared google drive has been created to come up with additional potential backup plans. So far, we are on track and excited about our progress so we are planning on following through with our plan as is.


Project Post #3

PROJECT POST #3

Project Title: Vis Hat  

Project Team: Lydia, Fu, Jay, Sharon

Weekly Accomplishments:

Lydia:

  • Sourced and ordered remaining materials
  • Researching more about brain data analysis, how to reduce noise of data, the form the data will be in
  • Researching and beginning to draft response test experiments for once the sensor/emitters are built and ready for use
  • Researching more about color/form correlation to emotion and coming up with plan/ideas for visualization of data; researching source code for data visualization that could be useful

Fu:

  • Researching the design, testing, working principle for project system and more papers about them.
  • Working on circuit design, including photodiode circuit, emitters and wiring to Arduino Due.

Jay:

  • Research: NIRS process, underlying physiology, brain physiology, parts research, methods and data processing research
  • Drafting circuit design
  • Drafting visualization plan

Sharon:

  • Research: design of the head band, brain analysis, algorithm
  • Read more papers about brain blood activity and design the algorithm
  • Understand how brain react with emotion changing

Images:

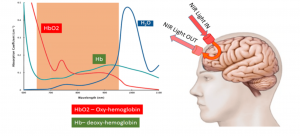
The following image shows the relationship between the absorption coefficient and the wavelength and illustrates working principle about how NIR light in and out are read.

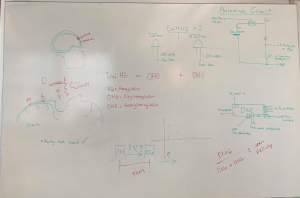
The following image shows the circuit design about the photodiode circuit, also about how emitters and photodiode are wired to the Arduino Due. We are going to measure the hemoglobin and deoxyhemoglobin, which are the modified beer lambert law we are going to use.

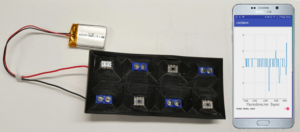
The following images show (1) a bluetooth-Arduino Due setup we’re planning to implement and (2) a sensor/emitter setup we’ve been researching and reading into as alternative to a previous set up. Our result could be a combination of the two (previous one pictured in Project Post #2).

Material List

title/link # needed price/unit notes shipping and tax TOTAL PRICE:
arduino due 1 34.43 34.43
NPN transistor 1 5.99 this one unit contains ~200 resistors 5.99
730nm emitter 2 8.61 9.54 26.76
850nm emitter 2 1.46 2.92
850 max nir detector/sensor 2 5.37 9.02 19.76
bluetooth 1 28.95 RN41XVC (with chip antenna) 8.81 37.76


Areas of Concern:

Some areas of concern have to do with the data we will be dealing with. Because we have yet to gather any data and a large portion of the project involves data analysis/clean-up, it’s hard to plan for possible obstacles in advance. Essentially, we will only be able to truly begin the software development stage once we understand further the state of the information we will receive from our sensor/emitter setup and once this data collection process has begun. Because this isn’t something to which we quite have access yet, reaching out for help would also not be the most beneficial at this time. However, once we gather some initial data in the early testing process, it would be beneficial to meet with someone (i.e. a professor possibly) experienced in brain data analysis. We’ve reached out to Professor Barry Vanveen, who has experience with this and who is willing to help us out when we reach this stage in the project.


Warmup Project Video Post

Cloud Soft Pillow Functions (in order within video):

1) This left/lower capacitive touch button activates a temperature sensor. The sensor then displays a single light around the adafruit with position and color corresponding to the temperature value in increments of 10 degrees F

2) The upper left capacitive touch button resets the device, turning off all lights and playing an A 440 pitch

3) The lower right capacitive touch button activates a sound volume sensor which displays a series of lights corresponding to the volume level at the time the button was pressed

4) When button A is pressed, a different version of volume sensing takes place — this time visualizing the volume level continuously in live time and displaying lights in response

Project Post #2

Project Title: Vis Hat

Group Member: Lydia, Jay, Sharon, Fu.

Group Member Weekly Updates:

Lydia

  • Researched material specifics and found links for items needed
  • Ordered materials
  • Emailed Justin Anderson (WARF) to follow up on getting in touch with BME Chair Justin Williams about hardware questions
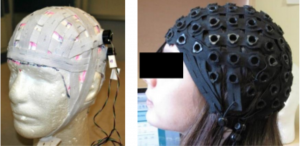
  • Continuing to research documents and do literature reviews for similar projects, taking note of hardware design/cap design overall

Jay

  • Researched frontal cortex physiology, studying up on how this process works to gain a better understanding of project variables
  • Researched materials: double checking, learning more about component terminology in preparation for the build
  • Studying circuit designs for similar projects, familiarization with circuit design diagrams and techniques
  • More logistics: gathering informational resources (papers, websites)

Sharon

  • Researched how brain waves work, studying and researching different mind reading products(EEG)
  • Materials searching and double checking
  • Researched sample codes for analyzing brain wave
  • Researched and learned different brain wave while in people in different stages

Fu

  • Researched materials and discussed about the IR led emitters and Aduino Due circuit board.
  • Studied the structure of the brain hat system and learn new knowledge about the circuit we need and signal processing.
  • Finding papers related to wearable brain monitoring system.

Changes to Approach:

The sensors used to measure brain data are called optodes. This week we extensively researched where to find these, with the plan of ordering however many optodes we would need and proceeding from there. We weren’t able to find any optodes for purchase and upon reading other papers and researching findings regarding similar projects, we found that other groups have built their own optodes by combining led IR emitters and sensor combinations. We’ve revised our plan to follow this path as well and are currently in the process of researching further circuitry approaches and the logistics of building this kind of hardware.

Images:

Materials:

** To be updated after we review the spreadsheet

Part/material Price per unit ($) Quantity Notes
730nm emitter 8.61 2
850nm emitter 1.46 2
NPN transistor 5.99 1 the unit we found includes over 200
arduino due 34.43 1
Shipping and tax 7.99, 1.55


Project Post #1: NIRS Cap

Project Title: NIRS Cap.

Group Member: Lydia, Jay, Sharon, Fu.

_________________________________________________________________

DESCRIPTION

1) What does your project do? (1-2 sentences)

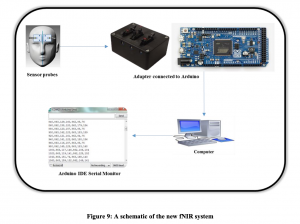
This project acts as a means to monitor brain response of an individual to environmental change, whether that be sound, light, temperature, people, etc. It will use an fNIRS technology which involves infrared sensors to monitor changes in the blood surrounding the brain close to the skull.

2) Who is your project for? (1-2 sentences)

The project will be for or adults (vs. kids or those with significantly smaller heads), ideally with hair, for short periods of time (~1-2 hrs max) as opposed to long term medical-grade studies where individuals are monitored for weeks to months at a time.

3) Describe how someone would use the developed device.  What are the steps that a user would go through to interface with the technology? (at least a paragraph)

Short Term:

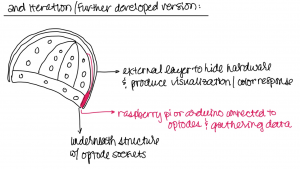
Color response of hat exterior to show change in data. For this we will draw from already existing color/emotion correlation research. Steps would include 1) positioning hat and optodes, 2) connecting processing device (i.e. computer, phone) using bluetooth with device, 3) observing response (hat color change, logged data)

Long Term:

Use for memory documentation. The hat could be used to track emotional response over time using optode sensors as well as coded machine learning processes to learn the specific responses of individuals. This could combine with additional sensors (light, sound, color, weather) and track the date/time, any music playing to log data spanning years. This kind of data could further be manipulated in a VR immersive space for people to expose themselves to surroundings similar to previous experiences. Such experiences could be useful for those with memory loss, in old age, in general for remembering, or for sharing experiences with new generations, family, or for historical study.

4) What makes your project different from existing products? (2-4 sentences)

Developed for personal use instead of medical use/research. Meant to be worn and integrated more seamlessly into someone’s lifestyle. Providing an experience not as visibly or experientially hindered by ‘technology.’ For personal data analysis. Not necessarily up to par with medical standards.

_________________________________________________________________

INSPIRATION images/artists/designers/projects that are relevant to your idea

What is already out there that is similar to what you are trying to do?

______________________________________________________________________

SKETCHES (digital or scanned of project)

How will the final product look

_________________________________________________________________

MATERIALS/TOOLS you’ll use/need

This is a great way to find out if your classmates have resources you can tap into

***include links for possible sources

  • At least one optode
  • Cap material
  • Light sensor and/or accelerometer

_________________________________________________________________

SKILLS/CONCEPTS  that you will need to master

For completion (for example soldiering, sewing, etc)

Current Experience:

Lydia: 3d modeling, sewing, 3d printing, laser cutting, art and design, some data analysis and visualization, knowledge of current research surrounding emotion/color/sound

Fu: Mechanical Engineering, 3D modeling(Autocad, Solidworks), 3D printing, laser cutting, hardware and software connections, circuits, programming, some signal processing.

Jay: Basic circuitry, data visualization, programming, data analysis, data noise reduction

Sharon: programming (machine learning, data structure, data analysis, AI)

Skills Needed for Project:

Sewing the cap, generating 3D models, 3D printing, building connections between the hardware and software, programming (signal processing, machine learning…), AI Data manipulation, Managing and analysing data on what that the hat has record

_________________________________________________________________

TIMELINE (where you would like to be when in the project)

Here are major milestone dates for you to work around

Milestone 1 (March 25): The technology for the project is shown to work

1-2 sensors reading some sort of consistent data and sending to computer through arduino or raspberry pi connection.

Milestone 2 (April 8): The technology has been shown to work in a wearable configuration

Demo setup: read consistent specific input (audio, visual, motion cue). Begun development of data visualization result/ideas/programming.

Milestone 3 (April 22): The technology and final wearable are fully integrated

Full Demo: Hardware is further developed (combined sensors) and cleaner design. Process of wearing device to data vis output in response to environmental change is cleaner.

Start with one (1) optode and measure response to different environmental change (i.e. light, sound, people, temperature, etc.).

  • Following a set of procedures that we develop/organize (meet with current faculty and/or students about their own procedures surrounding detection of brain response to hardware development and data analysis). Coming up with our own procedures.

_________________________________________________________________FALLBACK PLAN

What can you do to recover your project if it doesn’t go as planned?

What is the bare minimal outcome that you would consider a success?

Bare Min Outcome:

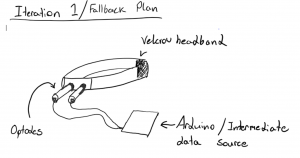
Working with one optode, doing minor data analysis, and projection data visualization to show response. Not constructing a full functioning cap, but a singular sensing area that shows some response.


Project_2

Lydia Schweitzer

CONCEPT IMAGE >>>>


RELATED IMAGES/INFO >>>>

interesting link

another interesting link

DESCRIPTION >>>>

NIRS or EEG based hat that gathers brain responses and changes color/produces visualization

Different way of communicating.

People can see elements of emotional/mental state.

For creative, poetic, experimental output, research purposes.

Future research- collect data over time for mental health field.

PROJECT ASPECTS >>>>

Confident:

  • Art experience
  • Some visualization experience
  • Music experience
  • Research on emotion/visualization material within health and psychology field

Not so Confident

  • Hardware, software
  • Data analysis